Multi-family Homes and Office Space Development & Sales Evaluation – Nov 2018
Let’s take a look at a few figures and notes about recent movements in the market. For the sake of this report, we’ll primarily focus on the real estate markets in Silicon Valley, SF, and the greater Bay Area. We will also take a look at some info regarding office space real estate developments in LA, Orange County, and San Diego as well. Please note that some info & graphic sources are cited at the bottom of this article.
The general outlook has not significantly changed in the last six months. The market is expected to continue to grow, perhaps at a slightly slower pace. Take a look at these graphs of Developer Sentiment:
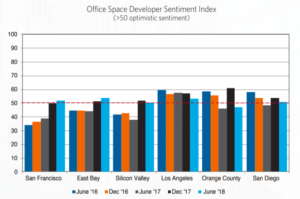
The apex of the office space market has been reached and the sentiment is neutral. Therefore it is reasonable to assume that prices per square foot will not rise in the upcoming months (if adjusted for inflation). By around 2021, a small decrease in building is expected.

Industrial markets trend has improved in the East Bay Area. Industrial and flex will probably be most in demand.
Reasons include: low vacancy rate, increasing freight movement, increased demand for online shopping (increased number of distribution centers in the Bay area). The market is significantly warehouse-dominated. The Santa Rosa Industrial market is especially strong.

Retail sector is in decline and the retail development sentiment seems to be getting lower. Our analysis: Expect decline throughout the next three years and conversion into experiential retail or mixed-use projects.
Other notes:
As usual, San Francisco itself remains an anomaly — the average price per square foot of commercial real estate properties in San Francisco over the last 24 months (Sep ’16 to Aug ’18): $623
Santa Clara County:
Single family homes sold last month (Oct ’18). The average selling price was $1,627,666
Days on Market was 25 and the list/sales price ratio 102%
Townhouse Market:. The average sales price for Townhomes was $1,144,008
List sales price ratio was 104% and Average Days on market was 19
For condos: average sales price was $834,174
LP/SP ratio was 103%; Days on market was 23
Contact us to learn more.
Citations:
| Title | URL |
City Real Estate Market Overviews by trulia.com |
https://www.trulia.com/real_estate/San_Francisco-California/ |
California Association of Realtors – Sales & Price Statistics |
https://www.car.org/en/marketdata/data/countysalesactivity |
Market Prices, Conditions & Trends in the San Francisco Bay Area by Paragon Estate Group |
https://www.bayareamarketreports.com/trend/bay-area-market-survey |
The Summer/Fall 2018 Allen Matkins/UCLA Anderson Forecast California Commercial Real Estate Survey |
https://www.allenmatkins.com/Publications/About/New-About-Allen-Matkins-UCLA-Forecast.aspx |
Local on-line reports for Northern California by rereport.com |
http://www.rereport.com/index.html |
The Summer/Fall 2018 Allen Matkins/UCLA Anderson Forecast California Commercial Real Estate Survey |
https://www.allenmatkins.com/Publications/About/New-About-Allen-Matkins-UCLA-Forecast.aspx |
2018 COMMERCIALREAL ESTATE FORECAST by KEEGAN & COPPIN COMPANY, INC. |
http://www.keegancoppin.com/pdf/market/2018_Commercial_Real_Estate_Forecast.pdf |